Back to Projects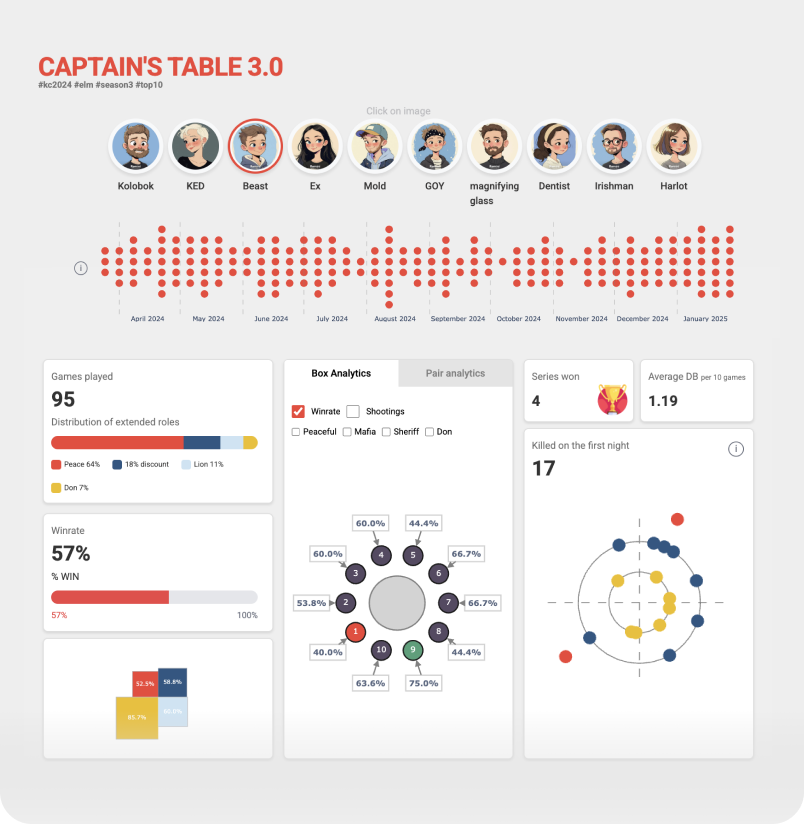
Sports Analytics · Python / Dash
Captain's Table 3.0
Real-time tournament analytics dashboard built for the Shiffer gaming community. Organizers and coaches use it during active runs — live standings, winrates, match history, and individual player stats update without a page reload. Stack: Python, Dash, Plotly.
Challenge
Participants wanted live stats during matches, not a post-game export. The data had to update without page reloads and hold up under traffic spikes when an entire tournament is watching simultaneously.
Solution
Dash callbacks handle real-time updates; Plotly was the right choice for lightweight chart rendering at that scale. The data model separates match, team, and player layers so any combination is queryable without reloading the full dataset.
Role
Data Analyst / Developer
Year
2025